
Website speed is an important part of running a successful website. Whether you operate a personal blog, a WordPress website, an online store, or a business website, slow-loading pages can frustrate visitors and make your website more difficult to use.
A visitor may leave before your homepage finishes loading. A potential customer may abandon a shopping cart because the checkout page responds slowly. Search engines also consider aspects of page experience, including loading performance, when evaluating websites.
But how do you know whether your website is actually slow? And how can you identify the problems that are affecting its performance?
One of the most useful free tools for this purpose is Google PageSpeed Insights.
PageSpeed Insights analyzes website performance on mobile and desktop devices. It provides performance measurements, identifies potential problems, and suggests improvements involving images, JavaScript, CSS, caching, and other components.
We will explain how to test your website with PageSpeed Insights, understand its results, and use the recommendations to improve WordPress and other websites.
1. What Is Google PageSpeed Insights?
Google PageSpeed Insights, commonly abbreviated as PSI, is a free online tool that evaluates the performance of individual web pages.
You can access it at:
The tool is provided by Google and does not require you to install software on your computer.
Simply enter a website URL, run the analysis, and review the results.
PageSpeed Insights combines two important sources of information: real-world user experience data and laboratory performance measurements.
Real-world data comes from the Chrome User Experience Report, also known as CrUX. This dataset provides aggregated information about how actual Chrome users experience eligible websites.
Laboratory data comes from Lighthouse, a website auditing tool that tests a page under controlled conditions.
PageSpeed Insights uses these measurements to help website owners identify slow-loading pages, delayed interactions, unexpected layout movement, and other potential performance problems.
The tool can analyze websites built with WordPress, Joomla, Drupal, custom PHP applications, static HTML, JavaScript frameworks, and other technologies.
However, PageSpeed Insights evaluates web pages rather than directly testing the hardware performance of your hosting server.
A poor result may be caused by the server, but it may also result from oversized images, excessive JavaScript, inefficient page design, or other front-end problems.
2. Why Is Website Speed Important?
Website speed affects several aspects of the visitor experience.
User experience: Visitors generally expect a website to respond quickly. Slow pages can create frustration, particularly on mobile devices or slower internet connections.
Visitor engagement: When important content takes too long to appear, visitors may leave before reading the page or completing their intended task.
Online sales: For e-commerce websites, slow product pages, shopping carts, or checkout processes can interfere with purchases.
Search visibility: Google uses Core Web Vitals as part of its broader evaluation of page experience. Good performance can contribute to a better user experience, although PageSpeed scores are not a direct guarantee of higher search rankings.
Server efficiency: Well-optimized websites can reduce unnecessary network transfers and server processing, potentially improving performance under higher traffic.
Mobile accessibility: Visitors using lower-powered smartphones or limited mobile connections may experience performance problems that are less noticeable on fast desktop computers.
For these reasons, website performance should be treated as an ongoing maintenance task rather than a one-time optimization project.
3. How to Test Your Website with PageSpeed Insights
Testing a website with PageSpeed Insights is straightforward.
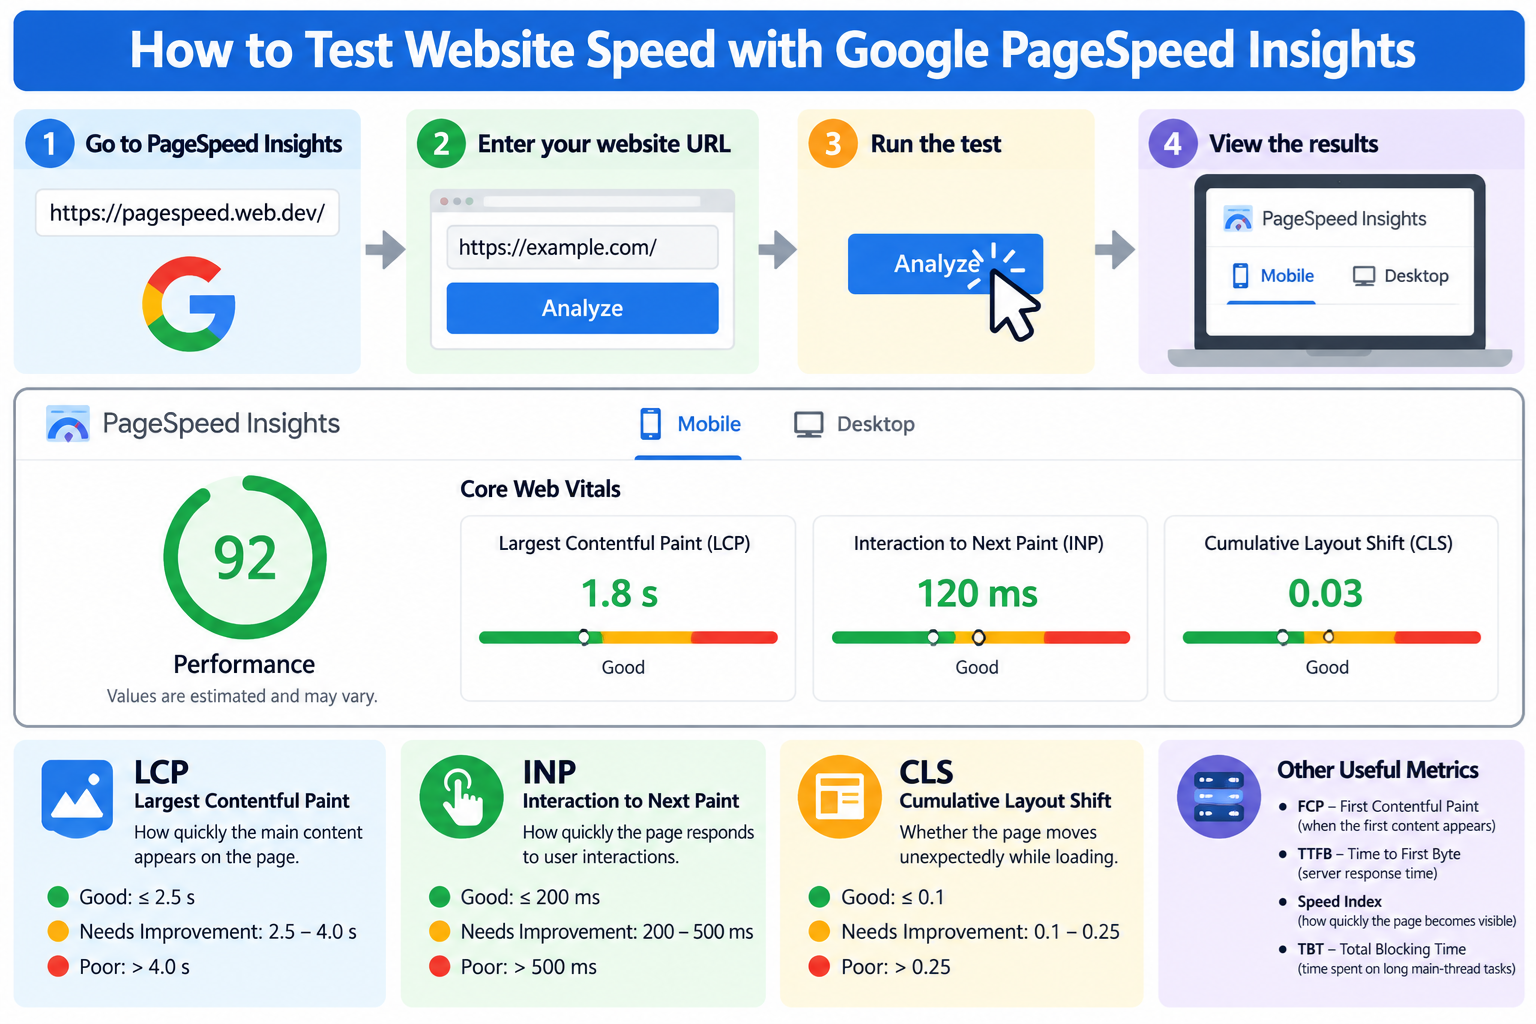
Step 1: Open PageSpeed Insights
Open your browser and visit:
You will see a field where you can enter the URL of the page you want to analyze.
Step 2: Enter Your Website URL
Enter the full address of your website, including HTTPS when applicable.
For example:
You can test the homepage or any publicly accessible page.
If you want to analyze a specific article, enter its complete URL:
https://example.com/how-to-install-wordpress/
Remember that PageSpeed Insights tests the specified URL. Testing your homepage does not automatically evaluate every page on your website.
Step 3: Click Analyze
Click the Analyze button.
PageSpeed Insights will retrieve performance information and run a Lighthouse analysis.
The process may take a little time depending on the requested page and the testing environment.
Step 4: Review the Mobile Results
PageSpeed Insights provides a mobile testing view.
Mobile testing is particularly important because smartphones often have less processing power than desktop computers, and real-world mobile connections can be slower or less stable.
Review the performance information and identify the largest problems.
Step 5: Switch to Desktop
Select the Desktop view and examine the results.
Desktop performance may differ significantly from mobile performance because the testing conditions, device capabilities, and page rendering characteristics differ.
Step 6: Record Your Results
Write down the important values before making changes.
At minimum, record the test date, tested URL, device category, Performance score, Largest Contentful Paint, and other available metrics.
This gives you a baseline for comparing performance after optimization.
4. Understanding the PageSpeed Insights Performance Score
One of the first things visitors notice in a PageSpeed Insights report is the Performance score.
The Lighthouse Performance score ranges from 0 to 100.
It is commonly displayed using three color categories.
90–100: Good
A score of 90 or higher is considered good in the Lighthouse scoring system.
This generally indicates that the page performs well under the simulated testing conditions.
50–89: Needs Improvement
A score between 50 and 89 indicates opportunities for performance improvement.
The page may contain inefficient resources, slow-loading elements, or other issues affecting the measured experience.
0–49: Poor
A score below 50 indicates significant performance problems under the test conditions.
These problems deserve further investigation, particularly if real-user performance data also indicates poor loading or responsiveness.
It is important to understand that the Performance score is not a simple measurement of how many seconds your website takes to load.
Lighthouse calculates the score from several weighted performance metrics.
Also, a score of 100 does not mean that the website is perfect, and a score below 100 does not automatically mean that visitors are having a terrible experience.
A website may have a relatively low mobile laboratory score while many actual visitors experience acceptable performance.
Likewise, a page with a good laboratory score may still perform poorly for some real users.
The score is a useful diagnostic summary, but it should not be treated as the only measure of website quality.
5. Mobile Speed vs. Desktop Speed
You may notice that your website receives a much lower score on mobile than on desktop.
For example, a hypothetical website might receive a desktop Performance score of 94 but a mobile score of 67.
This difference does not necessarily indicate a problem with the hosting company.
Lighthouse uses different testing conditions for mobile and desktop analysis, including simulated device and network characteristics.
Desktop computers generally have faster processors and more available resources than typical mobile devices.
JavaScript-heavy websites may therefore perform reasonably well on desktop but struggle under mobile test conditions.
Large images can also become problematic when unnecessary image data is transferred to mobile users.
Some websites load additional scripts, advertisements, tracking services, or page-builder components that increase processing requirements.
When optimizing a website, investigate both mobile and desktop results.
For many websites, improving mobile performance provides substantial practical benefits because mobile visitors are common and their devices may have greater performance constraints.
However, do not ignore desktop visitors or assume that the simulated mobile test represents every smartphone and network connection.
6. What Are Core Web Vitals?
Core Web Vitals are a set of metrics designed to evaluate important aspects of real-world website user experience.
Google’s Core Web Vitals focus on three areas: loading performance, responsiveness, and visual stability.
The three metrics are:
Largest Contentful Paint (LCP)
Interaction to Next Paint (INP)
Cumulative Layout Shift (CLS)
These metrics help answer three practical questions.
How quickly does the main content become visible?
How quickly does the website respond when a visitor interacts with it?
Does the page remain visually stable while loading?
PageSpeed Insights uses real-user measurements to evaluate Core Web Vitals when sufficient field data is available.
Understanding these metrics is more useful than simply trying to increase the Performance score.
7. Largest Contentful Paint (LCP): How Quickly Does the Main Content Appear?
Largest Contentful Paint measures how long it takes for the largest relevant content element in the visible portion of a page to be rendered.
This element may be a large image, a prominent heading, or another substantial block of content.
For example, imagine that you open a website homepage.
The navigation menu appears almost immediately, but the large banner image remains blank for several seconds.
Even though part of the page is visible, the main content has not finished appearing.
LCP helps measure this experience.
Google’s recommended LCP thresholds are:
Good: 2.5 seconds or less.
Needs Improvement: Greater than 2.5 seconds and up to 4.0 seconds.
Poor: Greater than 4.0 seconds.
For example, if a page has an LCP of 4.8 seconds, the main content is appearing too slowly according to this metric.
Common causes include large hero images, slow server responses, render-blocking CSS, excessive JavaScript, and delays in discovering important resources.
To improve LCP, start by identifying the actual LCP element in the PageSpeed Insights report.
If it is an image, optimize its size, format, loading priority, and delivery.
If it is a text element, examine whether fonts, stylesheets, or scripts are delaying rendering.
Do not automatically apply lazy loading to the main above-the-fold image. Delaying that image can make LCP worse.
8. Interaction to Next Paint (INP): How Quickly Does the Website Respond?
Interaction to Next Paint measures how responsive a page is to user interactions.
These interactions may include clicking a button, selecting a menu item, tapping a control, or typing into an input field.
Imagine that a visitor opens an online store and clicks an Add to Cart button.
If the page takes a noticeable amount of time to respond, the website may feel slow even though the initial page content loaded quickly.
INP helps evaluate this type of responsiveness.
Google’s recommended thresholds are:
Good: 200 milliseconds or less.
Needs Improvement: Greater than 200 milliseconds and up to 500 milliseconds.
Poor: Greater than 500 milliseconds.
For example, an INP value of 650 milliseconds indicates a responsiveness problem according to this metric.
JavaScript execution is a common contributor to poor responsiveness.
A website may run complex scripts, animations, analytics code, or third-party widgets that occupy the browser’s main thread.
When the browser is busy processing long JavaScript tasks, it may be unable to respond promptly to visitor interactions.
Improving INP often requires reducing unnecessary JavaScript, breaking up long tasks, simplifying event handlers, and investigating expensive rendering operations.
WordPress websites using complex page builders or numerous interactive plugins may benefit from reviewing their JavaScript workload.
Unlike some loading metrics, INP requires actual interactions. A Lighthouse page-load test alone cannot fully reproduce the range of interactions experienced by real visitors.
9. Cumulative Layout Shift (CLS): Does the Page Move Unexpectedly?
Cumulative Layout Shift measures unexpected movement of visible page elements.
For example, you begin reading a paragraph on a website.
Suddenly, an advertisement or image loads above the paragraph, pushing the text downward.
Or you attempt to click a button, but another element appears and moves the button just before you click it.
These unexpected movements create a poor user experience.
CLS is designed to measure this instability.
Google’s recommended thresholds are:
Good: 0.1 or less.
Needs Improvement: Greater than 0.1 and up to 0.25.
Poor: Greater than 0.25.
CLS is a unitless score rather than a measurement in seconds.
Common causes include images without reserved dimensions, advertisements inserted without allocated space, dynamically loaded content, and certain font-loading behaviors.
To improve CLS, specify appropriate image dimensions or aspect ratios, reserve space for embedded content, and avoid inserting new elements above existing content after the page begins rendering.
For WordPress websites, check images, advertisement placements, sliders, and page-builder components.
Visual stability is especially important on mobile devices, where smaller screens make unexpected movement more disruptive.
10. What Is First Contentful Paint (FCP)?
First Contentful Paint measures the time from navigation until the browser first renders qualifying page content, such as text or an image.
FCP differs from LCP.
FCP measures when the first visible content appears, while LCP measures when the largest relevant visible content element has been rendered.
For example, a website may display its logo after one second but take four seconds to display its main banner.
Its FCP may be relatively good even though its LCP needs improvement.
Google classifies FCP as good when it is 1.8 seconds or less, needing improvement above 1.8 seconds and up to 3.0 seconds, and poor above 3.0 seconds.
FCP is useful for diagnosing rendering delays, although it is not one of the three current Core Web Vitals.
Improving server response times, reducing render-blocking resources, and optimizing critical content delivery can help improve FCP.
11. What Is Speed Index?
Speed Index is a Lighthouse laboratory metric that evaluates how quickly the visible portions of a page become populated with content during loading.
Rather than focusing on a single element, it considers the visual progression of the page.
For example, a page that displays most of its content quickly may have a better Speed Index than a page that remains largely blank for several seconds.
Speed Index can be useful when investigating websites that appear visually slow even though some individual resources load promptly.
However, it is a laboratory metric, not one of the three Core Web Vitals.
Use it together with LCP, FCP, and other diagnostic information rather than optimizing it in isolation.
12. What Is Total Blocking Time (TBT)?
Total Blocking Time is another important Lighthouse laboratory metric.
It measures the amount of time between First Contentful Paint and Time to Interactive during which long main-thread tasks block responsiveness beyond a defined threshold.
Long JavaScript tasks are common contributors to high Total Blocking Time.
For example, suppose a WordPress website loads several third-party scripts immediately after the initial content appears.
If these scripts execute for extended periods without yielding control, the browser may be unable to respond promptly to input.
The page can appear visually complete while still feeling unresponsive.
Reducing unnecessary JavaScript and splitting large tasks into smaller pieces can improve TBT.
TBT is particularly useful for laboratory diagnosis of main-thread blocking.
However, it is not the same as INP and should not be treated as a direct replacement for real-world responsiveness measurements.
13. What Is Time to First Byte (TTFB)?
Time to First Byte measures the time between a request being initiated and the first byte of the response being received.
TTFB includes more than just PHP execution or database processing.
Depending on the measurement context, it can involve connection setup, network latency, redirects, and server response delays.
For a dynamic WordPress website, server processing may include PHP execution, WordPress initialization, database queries, and plugin operations.
A slow database, overloaded server, or inefficient application can contribute to a high TTFB.
However, geographical distance, network conditions, and other factors may also affect it.
Google’s field-data guidance generally considers TTFB of 800 milliseconds or less good, although TTFB is a diagnostic metric rather than a Core Web Vital.
If PageSpeed Insights identifies slow server response times, investigate whether the delays come from the hosting infrastructure, application processing, or network delivery.
For WordPress websites, server-side page caching and object caching may help reduce repeated processing.
A CDN may also reduce network latency or serve eligible cached responses closer to visitors.
But a CDN cannot automatically eliminate slow backend processing for every dynamic or uncached request.
14. Field Data vs. Lab Data: Why Do the Results Differ?
One of the most important PageSpeed Insights concepts is the difference between field data and laboratory data.
Field data represents real users.
PageSpeed Insights obtains field measurements from the Chrome User Experience Report.
These measurements reflect eligible real-world user experiences across different devices, network conditions, and browsing situations.
The reported data generally covers a rolling 28-day period.
Field data is useful for understanding how visitors actually experience a website over time.
Lab data represents a controlled test.
Lighthouse loads the page using simulated testing conditions and collects performance measurements.
This approach is useful for diagnosing specific technical problems and testing potential improvements.
However, a single laboratory test cannot represent every visitor, device, network, or interaction.
For example, your laboratory LCP might be 3.2 seconds while the field LCP is 2.4 seconds.
This difference does not necessarily indicate an error.
The two values come from different measurement conditions and datasets.
For evaluating actual user experience, field data is especially valuable.
For identifying technical causes and testing changes, laboratory data is often more actionable.
A good performance investigation uses both.
15. Why Does PageSpeed Insights Sometimes Show No Real-User Data?
Sometimes PageSpeed Insights displays a message indicating that real-user performance data is unavailable.
This commonly happens with newly published websites, low-traffic pages, or URLs that do not have enough eligible Chrome user samples.
The Chrome User Experience Report applies eligibility and privacy-related requirements before publishing aggregated data.
If a specific URL does not have sufficient data, PageSpeed Insights may display origin-level data instead.
Origin-level data represents eligible experiences across the website’s origin rather than only the individual tested URL.
If neither the specific URL nor the origin has enough qualifying information, field data may not be available.
This does not automatically mean your website is broken or that Google cannot access it.
You can still use the Lighthouse laboratory results to investigate performance.
Remember to distinguish origin-wide measurements from measurements of the specific page you are testing.
16. How to Read the PageSpeed Insights Recommendations
After the performance measurements, PageSpeed Insights provides diagnostic information and recommendations for improving the page.
The exact recommendations vary depending on the website and Lighthouse version.
Common issues include oversized images, render-blocking resources, unused JavaScript, inefficient caching, large network payloads, and excessive main-thread work.
Some recommendations may include estimated improvements.
These estimates are useful for prioritization but are not guaranteed results.
For example, a recommendation suggesting an opportunity to reduce loading time does not mean that implementing the change will improve the overall Performance score by a fixed amount.
Several performance issues may also be related.
An oversized hero image can contribute to both large network transfers and poor LCP.
A third-party JavaScript library can contribute to unused code, long main-thread tasks, and poor responsiveness.
Focus on the underlying technical problem rather than treating every diagnostic entry as an independent task.
17. Optimize Images to Improve Website Speed
Large images are one of the most common causes of slow page loading.
Modern smartphones and digital cameras can produce images with resolutions much larger than a website needs.
For example, an image measuring 4000 pixels wide may be uploaded to WordPress even though it is displayed at only 800 pixels wide.
Downloading unnecessary image data increases network transfer time and may delay rendering.
To optimize images, resize them to appropriate dimensions before uploading.
Use modern image formats such as WebP or AVIF when supported by your application and target browsers.
Apply suitable compression to reduce file size without introducing unacceptable visual degradation.
WordPress can generate multiple image sizes, and correctly configured themes can use responsive image markup to help browsers select an appropriate resource.
Pay particular attention to the largest image near the top of the page, because it may be the LCP element.
Images below the initial viewport can often benefit from lazy loading.
However, avoid delaying above-the-fold images that need to appear immediately.
The best image optimization strategy considers file size, display dimensions, format, loading priority, and visual quality together.
18. Reduce Unnecessary JavaScript and CSS
Many WordPress websites load CSS and JavaScript from themes, plugins, advertisements, analytics services, and other integrations.
Each resource can add network requests, transfer data, and processing work.
Some JavaScript files may also delay rendering or block the browser’s main thread.
PageSpeed Insights may identify unused JavaScript or CSS, long tasks, and render-blocking resources.
To improve performance, begin by identifying which plugins or theme components are loading unnecessary files.
Remove unused plugins and scripts where possible.
Consider deferring noncritical JavaScript or loading it only when required.
For CSS, reduce unnecessary styles and ensure that critical content can render without avoidable delays.
Minification can reduce file size by removing unnecessary whitespace and characters, but it does not remove the underlying computational cost of executing JavaScript.
Also, combining every CSS or JavaScript file is not automatically the best optimization strategy for modern HTTP/2 or HTTP/3 websites.
Test the effect of each optimization rather than applying every plugin setting simultaneously.
Aggressive JavaScript optimization can break menus, forms, shopping carts, and other interactive functions.
After making changes, verify that your website still works correctly.
19. Enable Browser Caching for Static Resources
Browser caching allows a visitor’s browser to reuse previously downloaded resources.
For example, a website logo, stylesheet, or JavaScript library may not need to be downloaded again on every page visit.
The web server can send Cache-Control headers that describe how resources may be stored and reused.
For versioned static resources, an appropriately long cache lifetime can improve repeat-visit performance.
For example, a server might send:
Cache-Control: public, max-age=31536000, immutable
This is suitable only when the resource URL changes whenever its content changes and the caching policy is appropriate.
It should not be applied indiscriminately to frequently updated HTML pages.
For WordPress websites using Apache, browser caching may be configured through hosting controls or supported .htaccess directives.
On Nginx servers, caching headers are configured through Nginx or the hosting platform.
Some WordPress caching plugins also provide browser cache configuration options.
If PageSpeed Insights identifies inefficient cache lifetimes, review the affected resources and determine whether their expiration settings are appropriate.
Remember that third-party resources may use caching policies controlled by their external providers.
20. Use a Content Delivery Network (CDN)
A Content Delivery Network distributes website resources through servers located in multiple geographic regions.
When visitors request eligible cached content, a CDN may serve it from a nearby location rather than requiring every request to reach the original hosting server.
This can reduce network latency and improve performance for geographically distributed visitors.
Cloudflare is one widely used CDN and reverse-proxy platform.
For WordPress websites, a CDN can help deliver images, stylesheets, JavaScript, and other eligible resources.
Some configurations also support full-page HTML caching.
However, HTML caching requires appropriate rules and exclusions, particularly for logged-in users, shopping carts, checkout pages, and other dynamic content.
A CDN does not guarantee a higher PageSpeed Insights score.
If a page’s primary problem is excessive JavaScript execution, delivering the scripts from a nearby server may reduce transfer delays without eliminating the browser processing cost.
Similarly, a CDN cannot fully resolve inefficient WordPress database queries for requests that still reach the origin.
Use CDN caching as part of a broader optimization strategy.
21. Improve WordPress Performance with Page Caching
WordPress dynamically generates many pages using PHP and database queries.
Without full-page caching, repeated requests may require the server to execute much of the same application logic.
A page caching system can store generated HTML responses and serve them to eligible visitors without repeating the complete generation process.
This can reduce server processing and improve response times.
Popular WordPress caching solutions include WP Rocket, LiteSpeed Cache, W3 Total Cache, and WP Super Cache.
Some hosting companies also provide server-level page caching through LiteSpeed, Nginx, Varnish, or proprietary infrastructure.
Choose a caching system that is compatible with your hosting environment.
If your hosting provider already supplies full-page caching, adding another independent page cache may be unnecessary.
Improperly configured overlapping caches can also make content updates difficult to manage.
After enabling caching, test the public website while logged out of WordPress.
Check important dynamic pages to make sure they are excluded from inappropriate caching.
Then run PageSpeed Insights again and compare the results.
Page caching may improve server response times and some loading metrics, but it does not automatically solve poor INP, large images, or heavy client-side scripts.
22. Does Web Hosting Affect PageSpeed Insights Results?
Yes. Web hosting can affect PageSpeed Insights results, particularly when server response time contributes to slow page loading.
However, hosting is only one part of website performance.
A modern website typically involves several systems:
Browser → CDN → Web Server → PHP → WordPress → Database
A slow response can originate from network conditions, web server processing, PHP execution, database queries, or caching behavior.
For WordPress websites, server CPU capacity, memory, storage performance, PHP configuration, and database efficiency can influence backend processing time.
Slow hosting infrastructure may contribute to poor TTFB and delay the delivery of HTML.
However, even a powerful dedicated server cannot automatically fix oversized images, blocking JavaScript, or poorly implemented page layouts.
Before upgrading hosting, examine the PageSpeed Insights report and identify the actual bottleneck.
If the largest delays occur during backend processing, investigate server resource usage, PHP workers, database query performance, and caching.
If the server responds quickly but the browser spends several seconds executing JavaScript, focus on front-end optimization.
The goal is to address the component responsible for the slowdown rather than assuming that purchasing more expensive hosting will solve every performance problem.
23. Test More Than Your Website Homepage
Testing only the homepage is a common mistake.
Different pages may use different templates, plugins, images, scripts, and database operations.
For example, a simple blog article may load quickly while a product page with interactive features loads much more slowly.
A contact page may load additional form scripts that are not required elsewhere.
An online store’s category pages may display numerous product images and filtering controls.
To obtain a more representative picture, test several important page types.
For a typical WordPress website, these may include the homepage, an article, a category archive, and a contact page.
For WooCommerce websites, public product and category pages are also useful candidates.
Do not submit private customer account pages or sensitive checkout URLs to public performance tools.
Record the results for each representative page.
This makes it easier to distinguish website-wide problems from issues affecting one template or plugin.
24. Why Does the PageSpeed Insights Score Change Between Tests?
You may run PageSpeed Insights several times and receive different Performance scores without making any changes to your website.
This is normal.
Laboratory measurements can vary because of differences in test execution, network conditions, resource timing, server response behavior, and other environmental factors.
Third-party advertisements, analytics services, and dynamically loaded content can also contribute to variability.
For example, a page might receive scores of 76, 81, and 78 across three separate tests.
A small difference does not necessarily indicate a meaningful performance improvement or regression.
For more reliable comparisons, run multiple tests using the same URL and device category.
Compare the median or typical results rather than relying on a single favorable score.
Also examine the underlying metrics.
If LCP improves consistently from 4.5 seconds to 2.7 seconds in comparable laboratory tests, that may be more informative than a small change in the overall Performance score.
Remember that real-user field data represents a rolling historical period and will not instantly reflect every optimization made today.
25. How to Compare Website Speed Before and After Optimization
Performance optimization is most useful when improvements can be measured.
Begin by selecting a representative page and recording its original PageSpeed Insights results.
For example, suppose a website initially produces these hypothetical laboratory measurements:
Mobile Performance score: 58
Largest Contentful Paint: 4.6 seconds
Total Blocking Time: 420 milliseconds
Cumulative Layout Shift: 0.18
After reviewing the report, you discover that the main banner image is excessively large, several scripts are unnecessary, and the page does not use effective caching.
You optimize the banner image, remove an unused plugin, adjust script loading, and enable suitable page caching.
After testing again under comparable conditions, the page might produce:
Mobile Performance score: 84
Largest Contentful Paint: 2.7 seconds
Total Blocking Time: 150 milliseconds
Cumulative Layout Shift: 0.06
These are illustrative values, not guaranteed results.
The important point is that individual technical changes can be evaluated through measurable outcomes.
Avoid changing ten unrelated settings simultaneously. When possible, make one meaningful change, test functionality, and compare performance.
This approach makes it easier to determine which optimizations are effective.
26. Does a PageSpeed Score of 100 Guarantee Better SEO?
No.
A PageSpeed Insights score of 100 is not a guarantee of higher Google rankings.
Google’s search ranking systems consider many factors, including relevance, content quality, usefulness, and other signals.
Core Web Vitals are related to page experience, but they do not replace the importance of useful content.
Also, the Lighthouse Performance score is different from the real-user Core Web Vitals assessment.
A website can have an excellent laboratory score without consistently providing good real-world performance.
A page may also have good Core Web Vitals without achieving a perfect Lighthouse score.
For most website owners, the practical goal should be to provide a fast, stable, responsive experience rather than obsessively pursuing a score of 100.
Fixing a serious loading delay is usually more valuable than spending hours trying to increase an already good score by one or two points.
27. Use Google Search Console to Monitor Core Web Vitals
PageSpeed Insights is useful for testing individual pages, but website owners may also want to understand performance across many URLs.
Google Search Console provides a Core Web Vitals report that groups pages according to real-world performance information when sufficient data is available.
You can access Google Search Console at:
https://search.google.com/search-console/
After verifying ownership of your website, open the Core Web Vitals report.
You may find information about mobile and desktop user experiences, including groups of pages classified as good, needing improvement, or poor.
This information can help identify templates or categories of pages that share similar performance problems.
For example, if many article pages have poor LCP, they may share an inefficient theme layout or image-loading configuration.
If product pages have poor INP, they may be loading expensive interactive scripts.
Use Search Console to identify broader patterns and PageSpeed Insights to investigate representative pages in greater detail.
Keep in mind that Search Console’s Core Web Vitals information also depends on historical real-user data. Changes may take time to appear in the report.
28. Common Mistakes When Using PageSpeed Insights
Website owners sometimes misunderstand PageSpeed Insights results or apply optimizations that create new problems.
Mistake 1: Focusing only on the Performance score. A score summarizes laboratory measurements but does not explain the entire visitor experience.
Mistake 2: Ignoring mobile performance. A website that works well on a powerful desktop computer may perform poorly on lower-powered mobile devices.
Mistake 3: Installing too many optimization plugins. Multiple plugins modifying caching, CSS, and JavaScript may conflict or duplicate work.
Mistake 4: Applying every recommendation blindly. Some optimizations can break website functionality or provide little practical benefit.
Mistake 5: Lazy-loading the main banner image. Deferring an important above-the-fold image may worsen LCP.
Mistake 6: Assuming every problem is caused by hosting. Large images, excessive scripts, and poor page design can reduce performance even on a powerful server.
Mistake 7: Testing only once. Laboratory scores can vary between runs, so several comparable tests are more informative.
Mistake 8: Ignoring real-user data. Laboratory measurements are useful for debugging, but field data helps show what visitors actually experience.
Mistake 9: Forgetting to test website functionality. After optimization, verify that menus, forms, shopping carts, search features, and other interactive components still work correctly.
A systematic approach produces better results than indiscriminately enabling every available optimization feature.
29. Frequently Asked Questions
Is Google PageSpeed Insights free?
Yes. PageSpeed Insights is a free tool provided by Google. You can analyze publicly accessible website URLs without purchasing a subscription.
Do I need a Google account to use PageSpeed Insights?
No. Basic PageSpeed Insights testing does not require signing in to a Google account.
Can PageSpeed Insights test WordPress websites?
Yes. PageSpeed Insights can analyze WordPress websites and many other types of publicly accessible websites.
What is a good PageSpeed Insights score?
A Lighthouse Performance score of 90 or above is classified as good. However, the score should be considered alongside Core Web Vitals and actual visitor experience.
Why is my mobile score lower than my desktop score?
Mobile and desktop tests use different simulated conditions. Mobile testing typically places greater constraints on processing and network performance, making resource-heavy pages more likely to receive lower scores.
Is PageSpeed Insights the same as Lighthouse?
Not exactly. PageSpeed Insights uses Lighthouse to generate laboratory diagnostics, but it also integrates eligible real-user performance data from the Chrome User Experience Report.
Does PageSpeed Insights measure actual visitors?
Yes, when sufficient eligible CrUX data is available. Its field-data section summarizes real-world user experiences, while its laboratory section measures a simulated page load.
Does a CDN always improve PageSpeed Insights scores?
No. A CDN may reduce network latency and improve resource delivery, but it cannot automatically fix excessive JavaScript execution, layout instability, or inefficient page design.
Can caching improve a WordPress website’s speed?
Yes. Appropriate caching can reduce repeated server processing and network transfers. However, caching should be configured carefully to avoid stale content or incorrect handling of personalized pages.
Should I optimize mobile or desktop first?
Test both. For websites with significant mobile traffic or serious mobile performance problems, mobile optimization may deserve priority. The final decision should also consider your real visitors and website goals.
How often should I test website speed?
Test after major theme updates, plugin changes, redesigns, hosting migrations, and significant performance optimizations. Periodic testing is also useful for identifying gradual performance regressions.
Can a slow database affect PageSpeed Insights results?
Yes. Slow database queries can delay WordPress page generation, increasing backend response times and potentially affecting loading metrics.
Why did my PageSpeed score improve but Core Web Vitals remain unchanged?
The Lighthouse score reflects a recent laboratory test, while CrUX field data typically represents a rolling 28-day period of real-user measurements. Improvements in real-user data may take time to become visible.
30. A Practical Website Speed Testing Checklist
Before making major performance changes, use this simple workflow.
- Open Google PageSpeed Insights at https://pagespeed.web.dev/.
- Enter the complete URL of the page you want to analyze.
- Run both Mobile and Desktop tests.
- Record the Performance score and available loading metrics.
- Examine the real-user Core Web Vitals data when available.
- Identify the main LCP element and investigate why it loads slowly.
- Review JavaScript execution and responsiveness-related diagnostics.
- Check images, CSS, fonts, and browser caching recommendations.
- Investigate server response time when backend delays are significant.
- Make targeted optimizations, verify website functionality, and test again.
For a WordPress website, begin with the changes most likely to improve the actual visitor experience. Image optimization, suitable caching, removal of unnecessary scripts, and correction of serious PHP or database delays often deserve early attention.
Use repeated measurements to confirm whether the changes worked.
Conclusion
Google PageSpeed Insights is one of the most accessible tools for understanding website performance.
It allows website owners to test individual pages on mobile and desktop devices, examine laboratory measurements, review real-world user experience data, and identify potential performance improvements.
The most important metrics to understand are Largest Contentful Paint, Interaction to Next Paint, and Cumulative Layout Shift. Together, these Core Web Vitals describe important aspects of loading speed, responsiveness, and visual stability.
For WordPress websites, performance problems may originate from oversized images, excessive JavaScript, inefficient themes, plugins, caching configuration, slow database queries, or inadequate server resources.
However, improving website speed is not simply a matter of purchasing faster hosting or installing an optimization plugin.
The best results come from identifying the actual bottleneck, applying an appropriate solution, and measuring the difference.
The goal is not merely to achieve a high PageSpeed score. The goal is to provide a fast, responsive, and reliable website for real visitors.